

Why this study matters to pathologists
PD-L1 testing in lung cancer is not a simple numerical exercise. The result we write in the report can change the course of immunotherapy, especially at the familiar thresholds: less than 1%, the intermediate group, and 50% or higher. Any digital tool that proposes a Tumour Proportion Score therefore has to be read from the standpoint of daily practice: where does it help, and where should it stop?
The article published by Pathology News summarizes an open-access PubMed Central study titled AI driven pre-regulatory validation of PD-L1 analysis in lung cancer. The study is not claiming to replace the pathologist. Its value is that it tests a practical workflow for a deep-learning tool that helps estimate TPS, then returns cases close to decision thresholds for manual review. That distinction matters.
In a working laboratory, the problem is not only the obvious case. The problem is the slide on the edge: is it below 1% or just above it? Is it around 50%, or within the 40 to 60% zone where confidence is harder? A good digital design can help here, but only if it respects the limits of the assay, the image, and the specimen.
What did the team do?
The researchers used 1,100 anonymized digital images of PD-L1 staining in formalin-fixed, paraffin-embedded NSCLC specimens, paired with 1,100 corresponding H&E images. The cases came from a routine diagnostic workflow in Northern Ireland and included adenocarcinoma and squamous cell carcinoma, from biopsies and resections. The Ventana Roche SP263 assay was used, and slides were scanned on an Aperio AT2 in SVS format.
For training and testing, a set of 396 cases was retained for model development. It was split into 65% training, 16% validation, and 19% testing. Among these cases, 131 were between 1 and 49%, and 127 were 50% or higher. These details matter because a TPS tool is not properly tested if it lacks cases near the reporting thresholds.
The model used a U-Net with a ResNet34 backbone. The aim was not only to produce an overall score, but to segment tumour cells into positive and negative cells while excluding background. The team used weighted cross entropy, a learning rate of 0.0001, and 100 epochs of training with image rotation and horizontal and vertical flipping. These are not decorative technical details. They are part of judging whether the model can be repeated and examined before any clinical use.
The numbers need a cautious reading
At the pixel level, the model recorded 93.08% accuracy, 74.62% sensitivity, and 93.71% specificity. At the cellular object level, positive precision was 94.58%, and recall was 81.36%. These are good numbers, but they are not enough by themselves for PD-L1 testing. A pathologist does not make a treatment decision from pixel accuracy, but from a reporting category with a direct effect on the patient.
The researchers therefore tested agreement with case-level TPS. In an initial independent sample of 30 images, half adenocarcinoma and half squamous cell carcinoma, the correlation coefficient between the pathologist’s estimate and the model score was 96.97%. This is encouraging, but it is not the end of the story. The borderline zones remained the real pressure point.
When results were divided into three TPS categories, the reported accuracy was 47.16% for the less-than-1% group, 95% for the 1 to 49% group, and 95% for the above-50% group. When divided into four narrower categories, the results were 88.3% for less than 4.9%, 90.90% for 5 to 39.99%, 66.67% for 40 to 59.99%, and 71.43% for above 60%. The number that should catch our attention is 66.67% around 40 to 60%. That is a treatment decision zone, not a statistical footnote.
The practical value: escalating difficult cases, not hiding them
The proposed clinical design treats cases close to 1% and 50% as cases that need pathologist review. This is the most important part of the study. The tool is not used to conceal uncertainty. It is used to expose it and route it to the person responsible for the report.
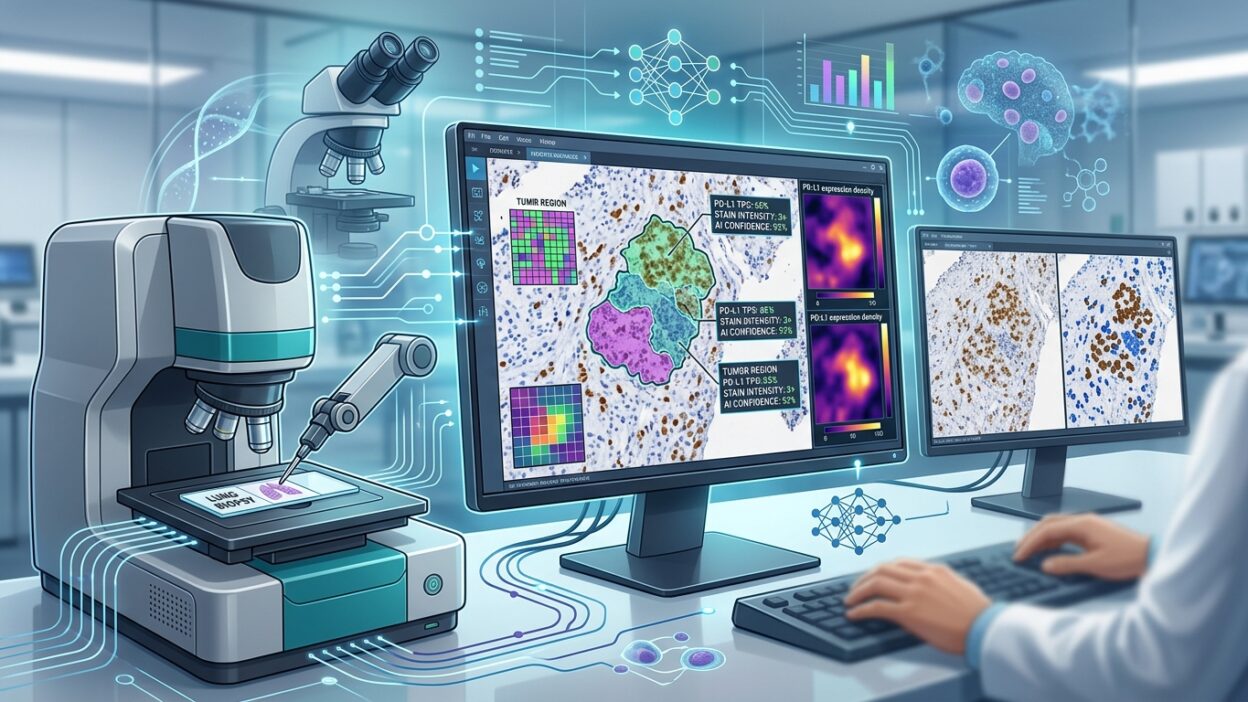
The study describes a workflow that keeps the human in the loop. The pathologist can upload an H&E image and review it alongside IHC, define an ROI, run the algorithm, then inspect the results on an overlay that shows which cells the model counted as positive or negative. In that setting, the number can be reviewed rather than treated as a black box that adds TPS to the report without visual explanation.
Having H&E beside IHC is not a minor detail. In PD-L1, macrophages may sit close to tumour cells and can confuse interpretation if the stained image is separated from the tissue architecture. The team used multiplex immunofluorescence including PD-L1, CD68, and cytokeratin to check the ground truth in areas near the thresholds. That is an appropriate choice because disagreement in PD-L1 is not always about staining intensity. Sometimes it is about the identity of the cell carrying the signal.
What does this mean for the laboratory?
If a laboratory is considering a similar tool, it should not start with the question: does the algorithm calculate TPS? The sharper questions are: which cases does it refer for review? How does it define uncertainty? Can the ROI be adjusted? Does the pathologist see a clear cell-level overlay? Are the review steps stored within an auditable quality system?
The study also points to a regulatory issue that matters as much as performance. The algorithm was transferred into a product under an ISO 13485 quality system, with documentation covering planning, intended purpose, annotation procedures, preprocessing, and risk analysis. For pathologists, these are not just administrative papers. They define who owns the decision, how errors are handled, and what happens when the tool encounters a case outside its training range.
Another point should not be ignored: cybersecurity. If the tool is cloud-based or connected to a digital workflow, the risks are not limited to downtime. Inputs, outputs, or the coordinates displayed on the overlay could be manipulated. The study connects this to risk assessment under EN ISO 14971 and IVDR. This kind of thinking should be part of a laboratory’s discussion before deployment, not after the first incident.
A short critical reading
I think the strength of the study lies in its recognition of zones that should not be left to the algorithm alone. High results in some categories are useful, but the real test is what happens near treatment thresholds. Here the team chose a reasonable path: human confirmation for clear cases, manual review for borderline cases, and visual support that helps explain the score.
At the same time, the data limits need attention. The cohort came from a defined regional source, using a known assay, scanner, and workflow. Moving the performance to another laboratory requires local validation: different stains, different scanners, differences in sectioning, and variation in ROI selection. No digital PD-L1 tool crosses these differences simply by being installed on a server.
The practical conclusion does not need exaggeration. AI tools in PD-L1 will be useful when they are designed to support the pathologist’s decision, not when they are sold as a shortcut to the report. Their best initial use may be to flag cases close to thresholds, provide a visible second read, and standardize discussion within the department around difficult cases. Only then does broader workflow expansion become a reasonable discussion.
Source
Pathology News: AI driven pre-regulatory validation of PD-L1 analysis in lung cancer